


 RADIO
RADIOIdentify the next ace with Thunder Dan Palyo's 2026 fantasy baseball pitcher breakouts. Why advanced metrics point to Hunter Greene, Gavin Williams, and Joey Cantillo as draft values.
Pitchers and catchers reported to camp this week, and I reported back to my duties as a fantasy baseball analyst after lending my time and research to both basketball and football since last season concluded.
I love researching and writing about baseball, especially pitchers. I was pretty excited to receive a nomination for "Best Research Article" by the Fantasy Sports Writers Association for a piece that I did last year on plate discipline stats and starting pitcher targets.
You can consider this piece a sequel to that one, as I dive back into those statistics to identify pitchers who showed major year-over-year improvements in their advanced metrics. I'm ready to roll up my sleeves and get back into the stats. Consider this my offseason research project, and what better way to kick off my starting pitcher content than with some deep stat dives, right?
Featured Promo: Save 50% the regular price with discount code SUMMER, for a limited time. Exclusive access to our Team Sync platform, DFS cheat sheets, Lineup Optimizers, betting/prop picks, and exclusive content from Nick Mariano and Eric Cross! GAIN ACCESS NOW
What Stats Are We Talking About?
Most of the statistics we will be focusing on in this article can be classified as "plate discipline" stats, which measure how often hitters swing and/or make contact with pitches both inside and outside the strike zone. Let's do a quick review of some of the most important statistics before we get too far ahead of ourselves.
SwStr% (Swinging Strike Rate) measures how often hitters swing and miss a pitcher's offering. It's highly correlated with strikeout rates, but it's an overall metric that doesn't tell us whether those pitches were inside or outside the zone, only that a hitter swung and missed.
The league average is often between 10% and 11%, and the higher the rate, the greater the likelihood of more strikeouts.
O-Swing% (Chase Rate) measures how often hitters swing at pitches that are outside the strike zone. Pitchers with high chase rates do something that deceives hitters enough for them to swing at pitches that appear hittable, but aren't. Whether it's heavy usage of breaking balls, the way that a pitcher tunnels their pitches, or even just the sequencing of their pitches, a pitcher's ability to get hitters to chase pitches outside of the zone usually results in more strikeouts and even fewer walks.
The league average is usually around 31-32%, and we are looking for higher rates here.
Z-Contact% (Zone Contact Rate) measures how often hitters make contact (including foul balls) when swinging at pitches inside the zone. Pitches in the zone are theoretically the most hittable, so a pitcher's ability to throw strikes that result in whiffs is highly desirable.
The league average is usually around 85%, and the lower the number, the better.
O-Contact% (Out of Zone Contact Rate) measures how often hitters make contact (including foul balls) when swinging at pitchers outside the zone. Pitchers with lower O-Contact rates have better "putaway" pitches, as hitters are less able to spoil their best pitches by putting them in play or fouling them off.
The league average is around 63-64%, and lower rates are better.
SIERA (Skill-interactive Earned Run Average) is an ERA indicator that attempts to determine a pitcher's true ERA without variance in batted ball luck or the quality of defense being played behind them. It's my go-to statistic as a baseline for pitcher performance.
Correlations with Changes In SIERA
What I originally set out to do was find which pitchers lowered their SIERA the most from 2024 to 2025, and then see what they had in common. Was there a single statistic (besides SIERA) that they all improved from one year to the next that we could identify?
The issue with that methodology was that only a relatively small sample of pitchers logged enough innings in both 2024 and 2025, and also lowered their SIERA. So what I did instead was calculate the difference in key stats for every starting pitcher (minimum of 75 innings pitched in both seasons), then look for patterns in their year-to-year performance and how they related to their SIERA.
So to be clear, what was being compared here was not the raw number (a pitcher's SIERA and SwStr%, for example), but the change in their SIERA from 2024 to 2025 relative to the change in their other key statistics. What I was hoping to find was the relationship between pitchers' overall improvement or deterioration (measured by SIERA) and their rates of change in other key statistics.
Here's a quick table that I will refer to containing my results.
| Pitching Metic | Correlation Coefficient |
| SwStr% | -0.745 |
| CSW% | -0.68 |
| O-Contact% | 0.566 |
| Z-Contact% | 0.505 |
| Ball% | 0.475 |
| O-Swing% | -0.38 |
| F-Strike% | -0.273 |
Remember that correlational coefficients are always represented as fractional decimals. A value of 1.0 would represent a perfectly positive relationship (Stat A increases at the same rate that Stat B increases), with a value of -1.0 representing a perfectly negative relationship (Stat A goes up at the same rate as Stat B goes down).
SwStr% was the big winner here with a very significant mark of -0.745. In the simplest terms, as pitchers improved their SwStr%, they also lowered their SIERA.
I didn't define CSW% in the introduction, but it adds called strikes to SwStr% and measures all strikes (both called and swinging) that are not put in play by hitters. The correlation there is strong, too.
O-Contact% and Z-Contact both check in with fairly strong correlations, too. Changes in O-Contact rates were much larger in either direction, with Z-Contact rate changes being a more tight distribution.
I found that changes in Ball% (number of balls thrown divided by total pitches) also had a positive correlation, but I'll touch more on that in a future article about strikeout and walk rates. For now, I want to focus on the plate discipline metrics.
O-Swing% was the lowest correlation of any of the plate discipline metrics. A -0.38 relationship is on the borderline of being considered statistically significant, and half as significant as SwStr%, but I'll still take a look at some of the biggest changes in chase rate anyway.
Last (and least) was the F-Strike% (first strike rate), which showed a fairly weak negative correlation. We all love when pitchers get ahead in the count, but compared to the other metrics, it really didn't have the same type of impact on SIERA.
A quick disclaimer here - you won't find pitchers like Chase Burns, Kyle Bradish, Emmet Sheehan, Nolan McLean, or Cole Ragans in this article because they failed to meet the innings requirement in either 2024 or 2025 (or both). And I reserve the right to cherry-pick the pitchers that I want to talk about from the results of the experiment - otherwise, this article will turn into a 5000+ word manifesto before you know it.
Biggest Swinging Strike Rate Improvers
| Pitcher | '24 SwStr% | '25 SwStr% | Increase |
| Trevor Rogers | 8.70% | 12.50% | 3.80% |
| Luis L. Ortiz | 8.80% | 11.90% | 3.00% |
| Cristopher Sanchez | 11.30% | 13.9 | 2.60% |
| Hunter Greene | 13.00% | 15.40% | 2.40% |
| Logan Webb | 8.50% | 10.70% | 2.20% |
| Kevin Gausman | 10.50% | 12.60% | 2.10% |
| Tarik Skubal | 14.60% | 16.60% | 2.00% |
No starter lowered their SIERA more from 2024 to 2025 than Trevor Rogers, who went from a 4.91 mark to a 3.75 last season. That difference isn't nearly as pronounced as the drop in ERA, which went from 4.92 to 1.81, but the SIERA marks remind us that he probably wasn't as bad in 2024 as it appeared or as good last year as his ERA suggests.
Rogers is going to show up on three of our four leaderboards in this article and also had the biggest improvement in Ball% (-6.25%). He had flashed some signs of dominance when in Miami, but finally put it all together in Baltimore last year. Whether or not he can replicate that this year over the course of a full season remains to be seen, but his improvement was across the board, suggesting that it probably wasn't a fluke.
I won't get into any Luis L. Ortiz analysis because it looks pretty likely that he won't be pitching again anytime soon, thanks to the gambling scandal that he's wrapped up in at the moment. But he did make it onto four of my six leaderboards and had the best season of his career as a starting pitcher.
Cristopher Sanchez took a huge leap last year, finishing the year as an elite starter with some of the best advanced numbers in the league. His changeup could be the filthiest pitch in baseball, and he added velocity and more horizontal movement to his two-seam fastball.
All 22 of Cristopher Sanchez's record-setting Changeup Swings and Misses from yesterday. 😯 pic.twitter.com/09ElE15zbt
— Rob Friedman (@PitchingNinja) April 18, 2025
Sanchez did everything well that we are looking for in a starting pitcher. He piled up strikeouts and groundballs while keeping walks down.
It's a long article, so I can't just gush about Sanchez the whole time. But, I mean, these Statcast sliders are pretty good, right?
Finally, we have to talk about Hunter Greene, who went from "very good" to "elite" in terms of his SwStr%. Greene's mark of 15.4% trailed only Tarik Skubal, Dylan Cease, and Logan Gilbert among all pitchers who threw 100+ innings last season.
His fastball performed about the same as it had in the last two years, but his slider was the key as he added 8% to his SwStr% on that pitch from 16% to 24%. He added several ticks of velocity to the pitch (up to 89 mph), while still maintaining the same amount of break. I am all over Greene in drafts this year. I think he's primed for a big season in 2025. He finally looked like the ace we have been waiting for him to develop into.
Biggest O-Contact Rate Improvers
| Pitcher | '24 O-Contact% | '25 O-Contact% | Decrease |
| Gavin Williams | 68.60% | 53.40% | -15.20% |
| Luis L. Ortiz | 67.90% | 55.40% | -11.60% |
| Kyle Freeland | 71.1 | 60.00% | -11.10% |
| Cristopher Sánchez | 67.20% | 56.20% | -11.00% |
| Logan Webb | 69.70% | 59.00% | -10.70% |
| José Soriano | 62.50% | 52.20% | -9.70% |
Let's start with who we won't discuss, and that's Kyle Freeland (who's not fantasy relevant) and Sanchez (because we already know how awesome he is). Also, Ortiz might be heading to jail.
So let's take a look at Gavin Williams, who finally broke out for the Guardians in 2025. He was a pretty popular breakout candidate going back a few seasons, but finally put it all together last year, especially in the second half of the year when he logged 70 1/3 innings to the tune of a 2.18 ERA and a 78:26 K:BB.
Gavin Williams, 7th and 8th Ks. pic.twitter.com/ivaISwt7cq
— Rob Friedman (@PitchingNinja) May 10, 2025
Williams saw a massive decrease in O-Contact% thanks to the effectiveness of his breaking balls. He ditched his slider in 2025 for a sweeper and threw both his sweeper and big-breaking curveball around 20% of the time. The sweeper had a 26% putaway% in 2025, compared to just 16% on his slider in 2024.
The change in pitch mix definitely explains the improvement in O-Contact% as both breaking balls pair extremely well with Williams' 96-97 MPH fastball. If he can continue to throw strikes and command the zone with his fastball, then he should keep getting plenty of whiffs outside the zone with those breaking pitches.
The other two pitchers on our list are sinker-ballers who both saw an uptick in strikeouts while still maintaining their status as innings-eaters and ratio stalwarts. No one eats more innings than Webb, but his value was enhanced by more strikeouts last year. He threw his sweeper more often in 2025 and his changeup less often, but both pitches individually saw a decrease in O-Contact rates.
Webb's value is still mainly tied to his durability and groundball-inducing ability, but the increase in strikeouts was some nice value added.
Soriano is a groundball machine, leading the league with a massive 69% GB% last year. Everything from Soriano breaks down as he features the sinker and then uses a curveball and splitter as his secondary offerings. The splitter was the one pitch that saw the biggest decrease in O-Contact% last year, as well as his sinker.
We'd still like to see more strikeouts and fewer walks, but his ability to get hitters to pound the ball into the ground has made him an interesting option later in drafts.
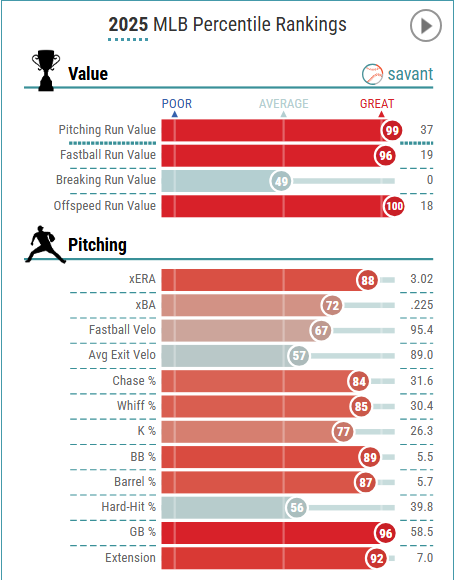
Though he didn't make the leaderboard, Edward Cabrera deserves a mention here as his 48% O-Contact% trailed only Gilbert and Tyler Glasnow among all starters who tossed 90 innings last season.
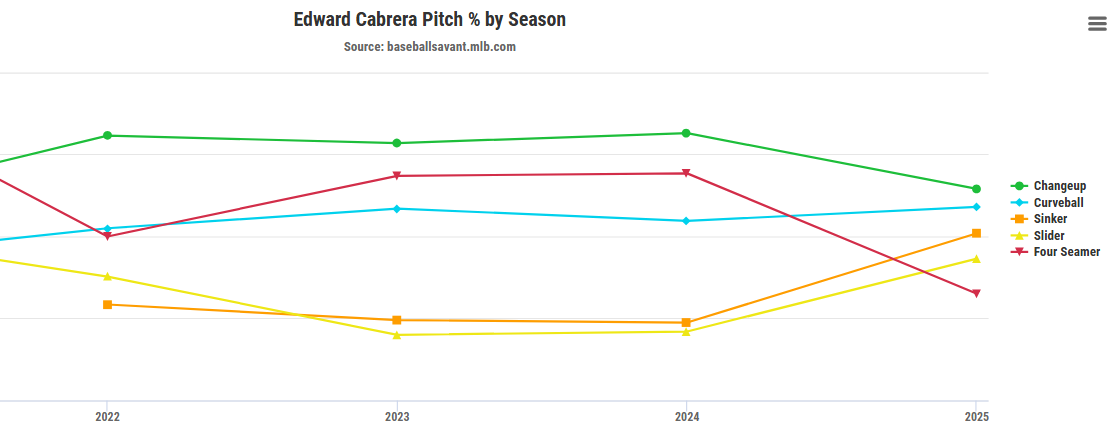
After struggling with control for his entire career, Cabrera finally found a pitch mix that worked for him, posting the lowest walk rate (8.3%) in five seasons. He ditched his four-seamer almost entirely, upped his sinker and slider usage, and threw his best pitch (his changeup) less often. It's a more balanced arsenal for Cabrera and one that kept hitters off balance without the walks we had seen in years prior.
He throws one of the hardest changeups in the game at 94 mph, and it's only a few mph slower than his two-seamer and four-seamer. But it had an elite 50% O-Contact% last year and pairs well with his main offspeed pitch, his 84 mph curveball that had a 29% O-Contact% last year.
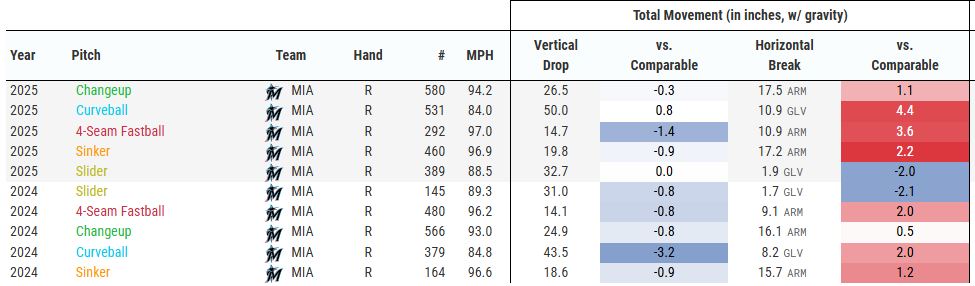
Cabrera dropped his arm slot to 36 degrees (he had been anywhere from 42 to 45 degrees in years prior), which led to some increased horizontal movement on his four main pitches. The added movement likely helps to explain the elite O-Contact% last year. He still gets hit a bit too hard when he's in the zone, but I am intrigued to see what he does in Chicago this year.
He clearly took a major step forward last year, and another tweak or two could push him up into the next tier of starters.
Biggest Z-Contact Rate Improvers
| Pitcher | '24 Z-Contact% | '25 Z-Contact% | Decrease |
| Trevor Rogers | 88.80% | 82.60% | -6.20% |
| Cristopher Sánchez | 86.50% | 82.00% | -4.50% |
| Nick Pivetta | 89.00% | 84.70% | -4.30% |
| Luis L. Ortiz | 88.40% | 83.80% | -4.00% |
| Casey Mize | 87.90% | 84.20% | -4.00% |
| Merrill Kelly | 91.90% | 88.00% | -3.90% |
| Ranger Suárez | 90.30% | 86.90% | -3.40% |
| Bryan Woo | 87.20% | 83.80% | -3.40% |
We have to circle back to Rogers quickly, as he tops the list of Z-Contact% improvers here. Rogers added 1.2 mph to his fastball, but still averaged only 93 mph on his heater. Yet, he was still able to miss bats in the zone at this velocity.
Trevor Rogers, 2Ks in the 4th.
5Ks thru 4 pic.twitter.com/CAXytDF27K
— Rob Friedman (@PitchingNinja) August 14, 2025
His changeup was sharper than ever, with a 15.8% SwStr% (up 2.3%) and a 58.6% Z-Contact% (down 7.8%). His slider saw a decrease in Z-Contact%, and the addition of a sweeper allowed him to throw two slightly different speeds of breaking balls to further differentiate his velocity from his fastball.
Nick Pivetta had the best year of his career in San Diego and looked like a true ace with his final stat line. I'm not totally bought on him being able to repeat that success this year, but his big improvement in Z-Contact% appears to have come from his sweeper, which he threw less often but got excellent results from it (68% Z-Contact).
He's still HR-prone, and it feels like he's operating on thin margins, but it was great to see him eat a ton of innings (181) with some fantastic ratios (2.87 ERA, 0.99 WHIP)
Casey Mize was a modest success story for the Tigers last year. Talk about a post-hype breakout: Mize was a major prospect many years ago and had his best season since 2021 last year. Mize upped his splitter usage by 8% and lowered the Z-Contact% on his splitter by 6%. Like Pivetta, he went from very hittable in the zone to right around league average, a promising development, but nothing to get overly excited about.
Bryan Woo has a magic fastball. I am not entirely sure how he does it, but he lives in the zone and manages to throw his four-seamer past hitters despite not having overwhelming velocity or crazy movement. Opponents hit just .153 against this pitch last season, and it had a +21 StatCast run value (third-best mark of any pitch behind Skubal's changeup and Sale's slider).
Bryan Woo's fastball was the best pitch in baseball by total run value in 2025 ... and the no. 2 fastball wasn't close pic.twitter.com/hrUQshzIog
— Travis Sawchik (@Travis_Sawchik) October 21, 2025
He might be a bit of an anomaly here, considering that his Z-Contact% is nearly identical to pitchers like Jacob deGrom and Chris Sale, yet Woo lacks the same type of strikeout upside. He doesn't have great secondary stuff, but he still misses enough bats and gets excellent results on batted balls. The issue is that he's being drafted early with other high-K, elite arms and isn't quite as flashy a pick.
I also want to mention Joey Cantillo here as a Z-Contact% superstar. Cantillo's 79% Z-Contact% was on par with that of pitchers like Skubal, Greene, and Blake Snell.
Cantillo doesn't throw all that hard, averaging 91-92 mph on his fastball, but has a devastating changeup that elicited a 24% SwStr% and only a 51% Z-Contact% from opposing hitters. He still has some control stuff to work out, but circle his name for the late rounds, and there's a good chance you'll see him show up in some other content of mine before Opening Day.
Biggest O-Swing Rate Improvers
| Pitcher | '24 O-Swing% | '25 O-Swing% | Increase |
| Shane Baz | 28.7 | 33.80% | 5.10% |
| Michael Lorenzen | 27.1 | 31.70% | 4.60% |
| Cal Quantrill | 27.40% | 31.80% | 4.40% |
| Colin Rea | 28.60% | 32.70% | 4.10% |
| Andrew Abbott | 31.10% | 34.70% | 3.60% |
| Hunter Greene | 32.70% | 36.10% | 3.40% |
| Dean Kremer | 30.40% | 33.00% | 2.60% |
| Nick Lodolo | 33.00% | 35.50% | 2.50% |
| Trevor Rogers | 31.50% | 34.20% | 2.70% |
| Tarik Skubal | 35.20% | 37.90% | 2.70% |
The most interesting name here is probably the guy at the top of the list, Shane Baz. The former Tampa (and Pittsburgh) prospect now finds himself in Baltimore for the upcoming 2026 season.
Baz had a mixed bag of results last year. His ERA and WHIP were a bit bloated, but he was still an above-average strikeout pitcher. He had hitters chasing his changeup and curveball more often last year, but still struggled a bit with his command, as his fastball got hit hard at times and he finished with a career-high 9% BB%. A change of scenery may help him out, and he certainly gets a ballpark upgrade after making his home starts in a Triple-A stadium last year.
We're skipping over the likes of Quantrill, Rea, Lorenzen, and Kremer. While they all saw solid increases in their chase rates, their 2025 rates were still right around league average. Kremer is the only guy there with a little bit of fantasy appeal, though he could be in a battle for the last spot in the rotation with Cade Povich.
That leaves us with two Cincinnati lefties to discuss, Andrew Abbott and Nick Lodolo. Abbott had the best year of his career and defied many advanced metrics in doing so. He doesn't overpower hitters, but he did show impressive command of all of his pitches and was a master of inducing weak contact. I am probably not betting on him doing it again, but I also think he might be one of these guys who has just figured out how to pitch, and therefore, it's very tough to glean much from his underlying statistics.
Lodolo is more intriguing to me (I get sucked back in every year, it seems). He dropped his arm slot down even lower to just 15 degrees, and because of that, he gets nearly 17 inches of arm-side run with his fastball. His changeup moves down and away from righties, too, while he can bury his curveball in the dirt to get hitters to chase when he's ahead in the count.
Nick Lodolo, Dirty 83mph Curveball. 😨 pic.twitter.com/urmjGI5h5S
— Rob Friedman (@PitchingNinja) April 15, 2025
Oh, and there's Greene, Rogers, and Skubal on the list again. I didn't touch on Skubal (and maybe it's not all that relevant with his first-round ADP), but the fact that he improved last year and won another Cy Young after having one of the most dominant seasons in recent memory in 2024 was simply amazing. I'm a Pirates fan, but there shouldn't be a debate between Skenes and Skubal - Skubal is still the best pitcher in baseball.
Conclusion
In terms of which stats I am honing in on closely year over year, SwStr%, O-Contact%, and Z-Contact% are three metrics that have proven strongly correlated with improvements in SIERA. And SIERA itself is an effective tool for predicting ERA going forward. These are not the only stats you should be looking at, but they were the main focus of my mini research project and are much more closely tied to pitcher performance than stats that are more likely influenced by luck (ERA, HR/FB, LOB%, BABIP).
Here are some takeaways that I mentioned in the article at one point or another.
- Tarik Skubal is still really, really good - as if you needed to hear that.
- Cristopher Sanchez is closer to Skubal than he is to the rest of the pack. I expect another huge year.
- Hunter Greene just needs to stay healthy; he has all the makings of a dominant Cy Young candidate.
- Trevor Rogers came out of nowhere to post incredible numbers in 2025. Even with a little negative regression this year, he should still be pretty good.
- Gavin Williams has the arsenal of a bona fide ace. If he can start the year the way he finished last season - watch out.
- Joey Cantillo is an intriguing late-round pick as a potential breakout candidate with his ability to miss bats inside the zone.
- Edward Cabrera finally put it all together last season. If the good control sticks, he's a compelling pick this year on a good team where he'll get much more run support.
If you made it this far, you're a true stat nerd, and I applaud your attention span. That kicks things off for my coverage of starting pitchers this offseason. The next article is just around the corner - stay tuned!
More Fantasy Baseball Advice
Download Our Free News & Alerts Mobile App
Like what you see? Download our updated fantasy baseball app for iPhone and Android with 24x7 player news, injury alerts, sleepers, prospects & more. All free!