


 RADIO
RADIOCorbin's hitter fantasy baseball sleepers, risers, fallers based on new swing path and attack angle metrics. Which stats help predict fantasy baseball performance?
About a month ago, we heard much about torpedo bats, particularly bat speed and bat tracking, as a hot topic. I researched the bat tracking data, finding that some of it can be noisy, although it's helpful to identify what matters. Mike Petriello of MLB.com covered the new swing path and attack angle metrics available, sparking this article to dig into which ones matter for fantasy purposes. Thanks to "Thunder" Dan Palyo for the inspiration.
Swing Path or Tilt is the swing shape, as we talk about a flat, chop, or uppercut swing. We would assume that hitters with steeper swing paths might hit more flyballs or intend to do so. The opposite is also true. Hitters with steeper swing paths involve ones around 40 degrees or higher. Meanwhile, flatter swings are prone to more line drives hovering around 20 degrees. However, we're used to zero degrees as the midline in other metrics. Petriello explains that no hitter's swing moves perfectly flat to the ground, which makes sense. The league average swing path is around 32 degrees.
The other notable metric we'll cover and examine deeply is ideal attack angle rate, which is the percentage of swings with an attack angle within the 5-20 degree range when a hitter makes contact. Petriello mentioned that hitters produce better outcomes when their swings have an ideal attack angle. For context, the league average for ideal attack angle rate is around 50-51 percent.
Featured Promo: Save 50% the regular price with discount code SUMMER, for a limited time. Exclusive access to our Team Sync platform, DFS cheat sheets, Lineup Optimizers, betting/prop picks, and exclusive content from Nick Mariano and Eric Cross! GAIN ACCESS NOW
Which Swing Path Metrics Matter?
After examining the correlations between the swing path and ideal attack angle rate metrics, let's discuss which ones matter. Ideal attack angle rate showed a low correlation (0.137) to bat speed, with an inverse relation to Swing Tilt (-.207). That suggests that Swing Tilt drops as the ideal attack angle rate goes up. Since ideal attack angles are between 5 and 20 degrees, the inverse relationship makes sense.
Swing Tilt correlates well with Attack Angle, which isn't surprising. One would expect the swing path to support the attack angle, but the pitch types and locations are the variables. Ideal Attack Angle Rate might be the most interesting with the new data, and it correlates best with barrels per plate appearance (.205). However, the ideal attack angle rate correlates somewhat poorly with average exit velocity (.129) and wOBA (.010). All the data comes from the past two seasons.
The other notable metric involves Attack Direction, telling us whether a hitter pulls or sprays the ball toward the opposite field. If a hitter has an attack direction more toward their pull side, we would expect them to have higher pull rates. That can also tell us where a hitter tends to attack the ball, whether it's out front or behind the ball. Typically, a hitter pulling the ball tends to generate more power and better bat speed or exit velocity data.
Hitters With High Bat Speed and High Ideal Attack Angle Rates
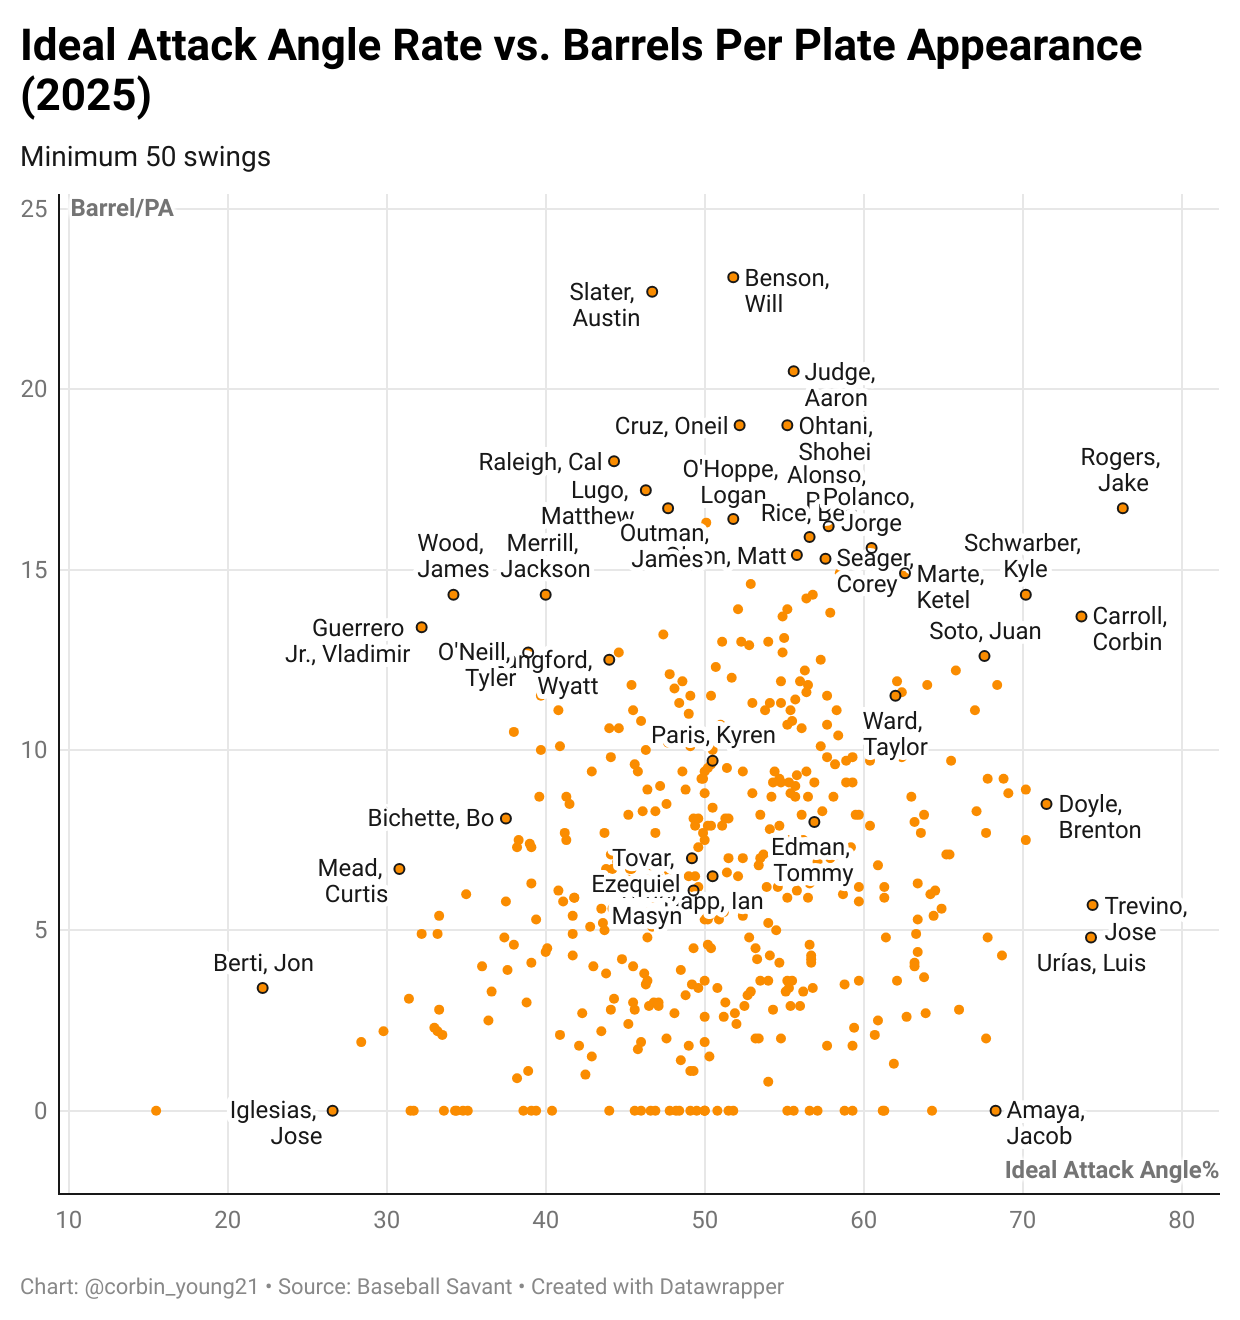
The league average Ideal Attack Angle rate is around 51 percent, with a 72 mph league-average bat speed. So we'll use a filter of an Ideal Attack Angle rate of 55 percent and a bat speed of 74.5 mph in 2025. Any filter should have a mixture of near-elite and noisy hitters. That's evident in the visual below.
We have the expected names, Corbin Carroll, Kyle Schwarber, Shohei Ohtani, Pete Alonso, and Aaron Judge, when filtering by those thresholds. Ohtani and Judge have above-average ideal attack angle rates, but they're not in the elite range like Carroll and Schwarber. We know that these metrics are one piece of the puzzle, especially since Ohtani and Judge have steeper bat paths and solid attack angles.
Meanwhile, Jo Adell, Brett Baty, Addison Barger, and Daulton Varsho might be the other surprising names with fantasy relevance. Adell's surface numbers look awful, but a .233 xBA isn't far from his career averages with better contact rates (72 percent) and career-best power metrics (127 Expected Power Index, 7.7 percent barrels per plate appearance).
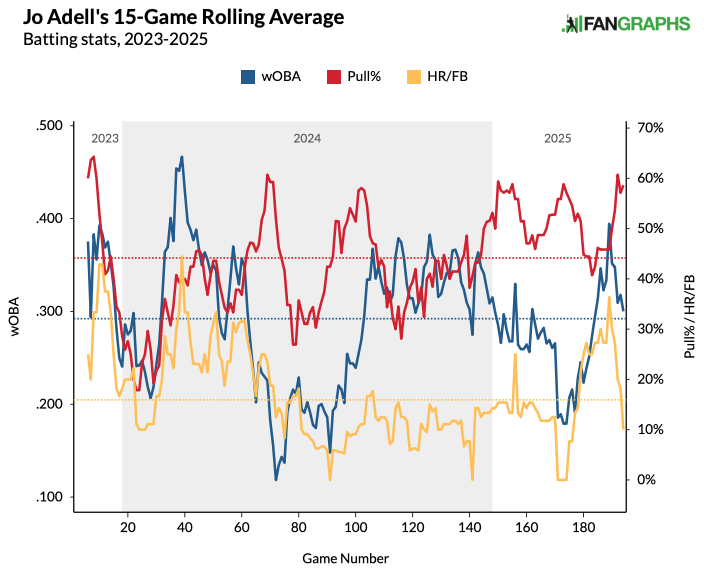
Adell's pull rate spiked to a career-high (52 percent), with a four-degree increase in his attack direction, aligning with the pull rates. Furthermore, Adell's ideal attack angle rate increased by 12 percentage points in 2025, again aligning with the contact quality metrics.
Baty added nearly three mph of bat speed in 2025, with a slightly flatter swing path (three degrees), and a 13 percentage point increase in ideal attack angle rate. Interestingly, Baty's attack direction shifted from one degree toward the pull side, meaning it's nearly toward center field. Now, Baty's attack direction went four degrees toward the opposite, aligning with a slight dip in his pull rate by five percentage points.
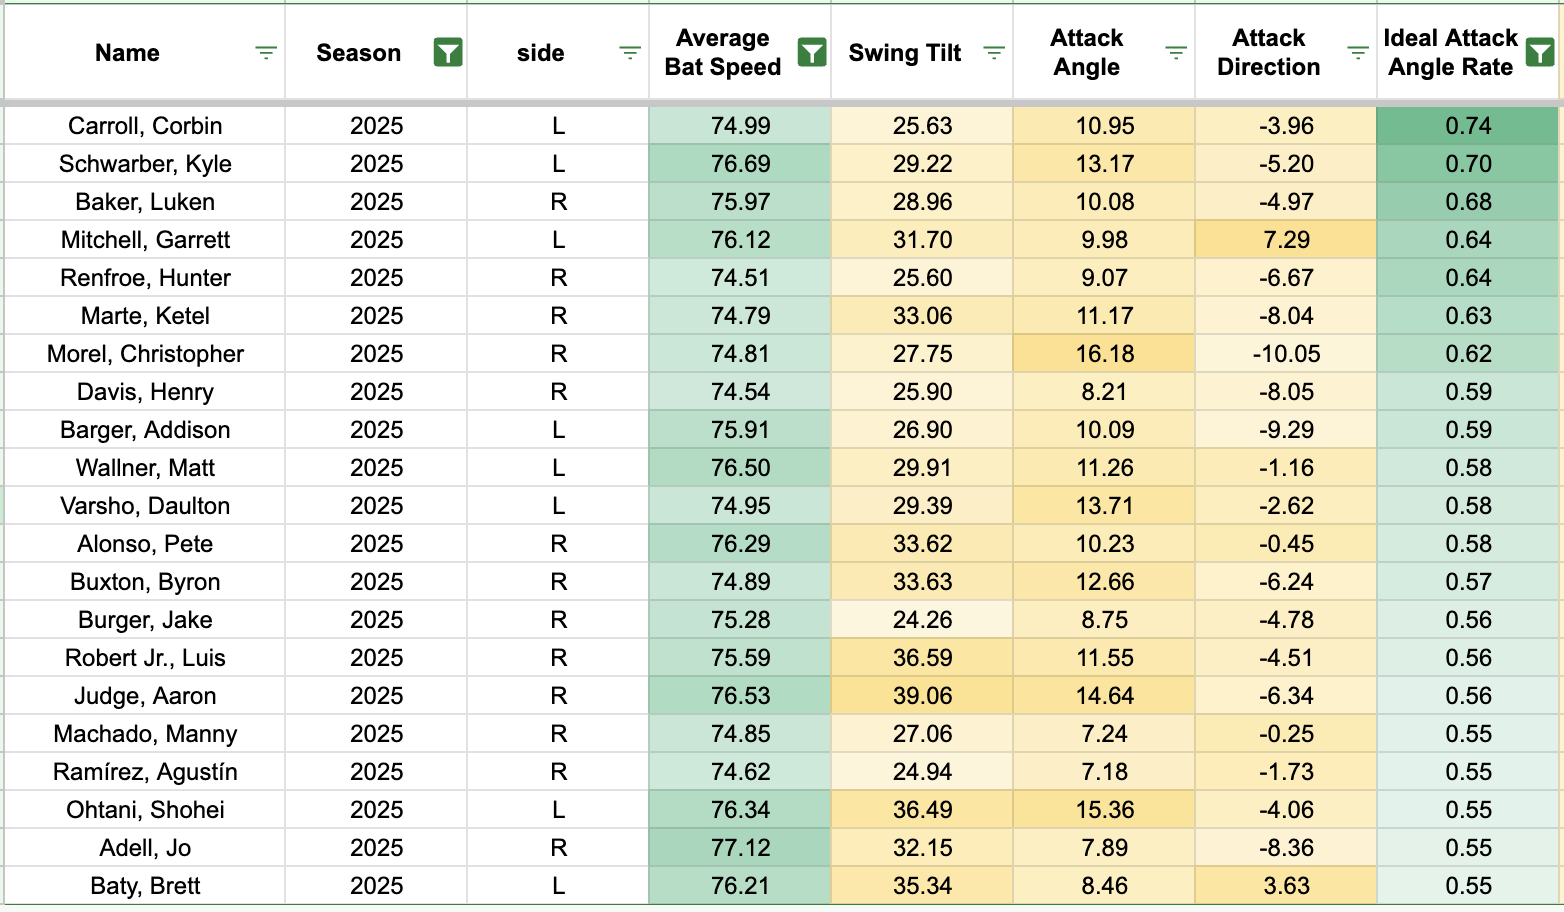
The visual below shows the hitters with a 10 percentage point increase in ideal attack angle rate in 2025, with above-average numbers (above 51 percent ideal attack angle rate).
Addison Barger made a concerted effort to pull the ball more often, with a 10-degree attack direction move toward his pull side. Barger's bat speed increased by 1.5 mph, with a 14 percentage point increase in his ideal attack angle rate in 2025. Barger's swing path is flatter, flattening out by six degrees. That could lead to more consistent launch angles for Barger. However, his ideal attack angle rate, supported by the pull percentages and bat speed, gives us confidence.
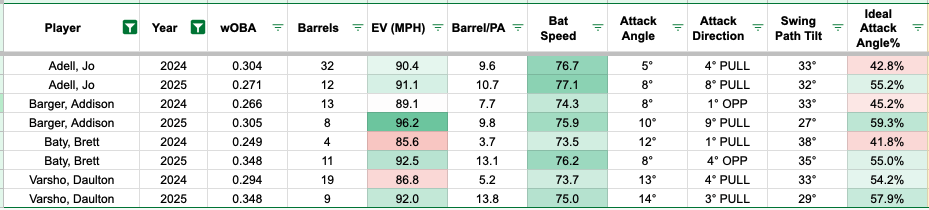
Varsho battled knee, back, and shoulder injuries throughout 2024, so we've seen the exit velocities via the barrel rate and exit velocities increase. That's notable because Varsho's swing path, attack direction, and ideal attack rates stayed the same over the past two seasons.
Hitters With High Bat Speed and Low Ideal Attack Angle Rates
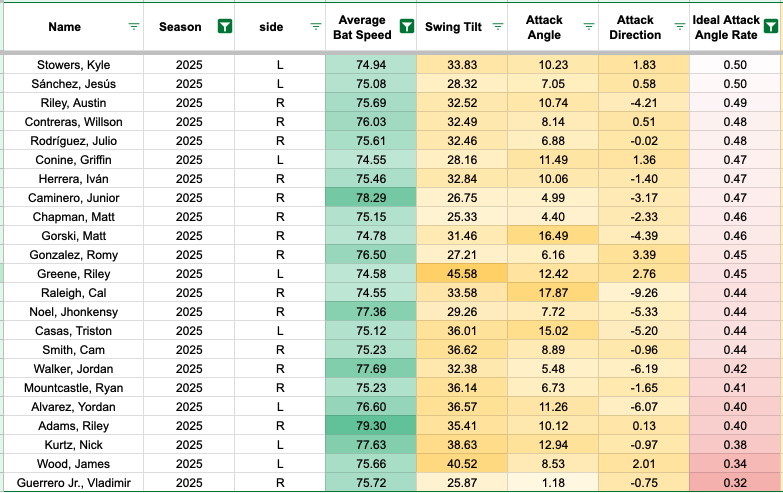
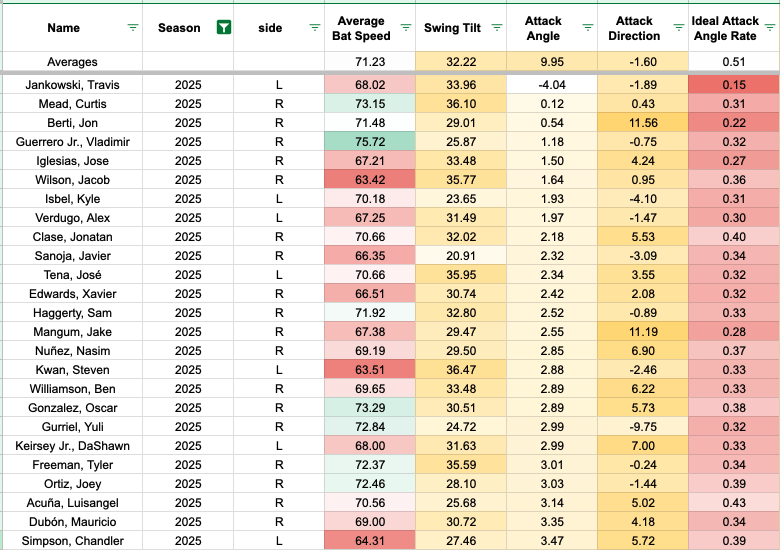
We shouldn't sound the alarms, but we wanted to examine hitters with the lowest ideal attack angle rates and high bat speeds. That's mainly because bat speed translates to average exit velocities, but how does the ideal attack angle rate connect to it? Several notable hitters made this list, including Kyle Stowers, Jesus Sanchez, Austin Riley, Julio Rodriguez, Junior Caminero, Matt Chapman, Riley Greene, Cam Smith, Jordan Walker, James Wood, and Vladimir Guerrero Jr.
The visual below shows the hitters with a below-average ideal attack angle rate (below 51 percent) and high-end bat speed (74.5 mph or higher) in 2025.
Maybe there will be a part two for this article, but we'll highlight Stowers, Rodríguez, Greene, Walker, and Guerrero Jr. With Stowers, he maintained his swing path and attack angle. However, he had slightly better bat speed, average exit velocities, and barrel rates. Stowers pulled the ball 3-4 percentage points more in 2025, though the HR/F luck factors (21.3 percent) shifted in his favor.
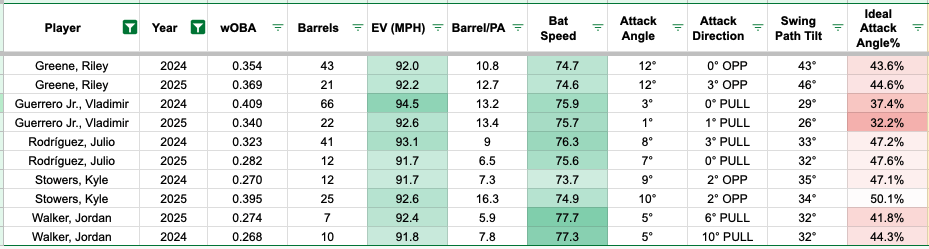
Rodriguez increased his contact rate to 79 percent, six percentage points above his career average. He became more aggressive in the zone, evidenced by his 77.6 percent zone swing rate, over four points above his career norm. Rodriguez's average exit velocities and barrel rates dipped in 2025, though the launch angle variability aligns with the below-average ideal attack angle rates.
That's evident by Rodriguez's ADd Quality of Batted Ball Score via BaseballHQ, which accounts for exit velocity, launch angles, and launch angle variability in that order. Like grades, it shows Rodriguez's contact quality isn't an issue, but high groundball rates and launch angle inconsistencies are problematic.
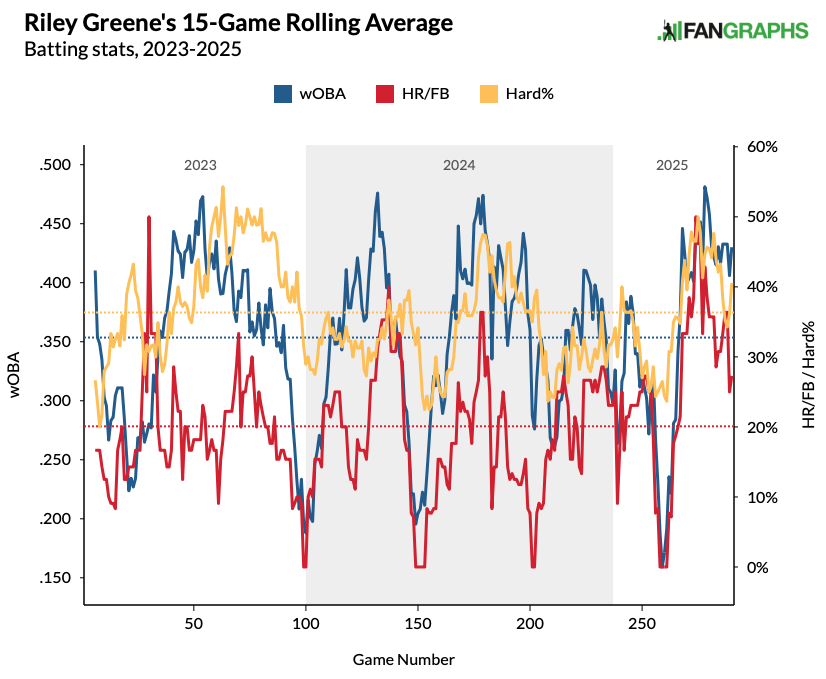
Like Stowers, Greene's swing path metrics were similar to last season, with a slight uptick in his swing path being steeper. That's interesting because Greene's flyball rate fell three percentage points, yet his HR/F skyrocketed to 27.3 percent, 10 points above his career average. Though Greene boasts above-average exit velocities, he has been outperforming his power metrics with a 166 Power Index and 115 Expected Power Index.
Walker has been a bat-speed monster, with elite numbers around 77 mph or higher over the past two seasons. He struggled with a lower ideal attack angle rate, though the attack direction shifted four degrees toward the opposite field. We've seen Walker's attack direction align with the pull rates dropping to a career-low 34.7 percent versus a career average of 39.1 percent.
Guerrero Jr. has a flatter swing, leading to the fourth-lowest attack angle at around one degree. For context, the league average attack angle hovers around 10 degrees, with zero being parallel to the ground, making it a ridiculously flat line drive. Guerrero Jr.'s ideal attack angle rate has been one of the lowest in the league, mainly because his average attack angle is below the ideal range of 5-20 degrees.
It's been an issue of launch angle consistency for Guerrero Jr., and thankfully, he crushes flyballs and line drives, with a 97 mph average exit velocity (No. 21) in 2025. Though one could argue these swing path metrics might be noisy and irrelevant, they help paint a deeper picture of a hitter's swing path, attack angles, and where they attack the ball.
Wrapping It Up
Ideal attack angle rate, swing tilt, attack angle, and attack direction all have value in examining a hitter's swing. If we were to prioritize a few, it would be swing tilt and ideal attack angle rate. A hitter's ideal attack angle rate somewhat suggests if a hitter shows the optimal attack angles, potentially leading to ideal launch angles. However, we typically need to pair these metrics with bat speed and exit velocity numbers to examine whether a hitter's swing paths and attack angles lead to better contact quality.
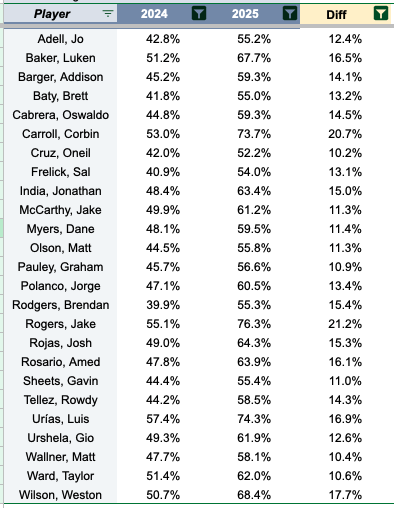
The visual below shows hitters with a swing tilt difference of 1.5 degrees in the positive or negative direction in 2025 compared to 2024. We also included their ideal attack angle rates.
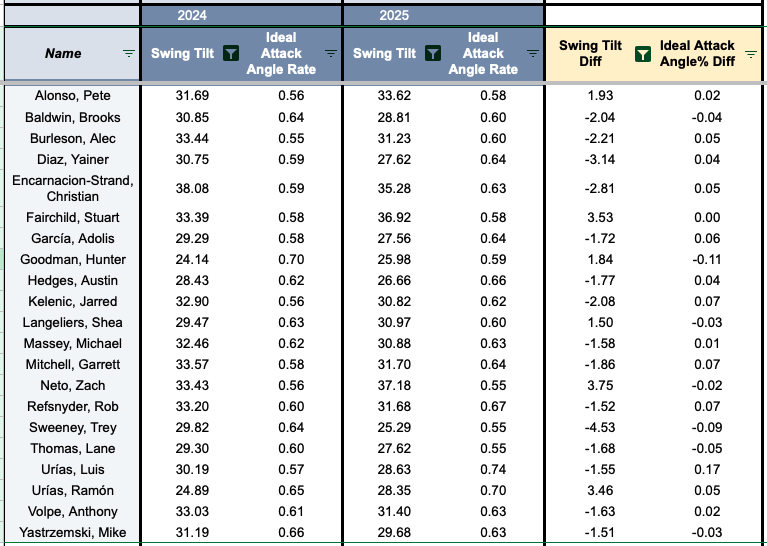
What's probably more helpful is when examining the swing path metrics from year to year to see whether a hitter made changes. Sometimes we can see if a hitter pulls the ball more or hits more flyballs, but the swing path metrics show us whether they have or haven't been concerted efforts. That's further evident when changes occur with two or more metrics (swing path, attack angle, attack direction, and ideal attack angle rate). When we hear about swing or approach changes, these inputs tell us whether the talk matches the action.
Download Our Free News & Alerts Mobile App
Like what you see? Download our updated fantasy baseball app for iPhone and Android with 24x7 player news, injury alerts, sleepers, prospects & more. All free!