


 RADIO
RADIORick's sabermetrics glossary explaining how to use sabermetrics for 2026 fantasy baseball. His advanced stats guide helps you with draft prep and roster management.
Hello, fellow RotoBallers! Sabermetrics have become an integral tool for fantasy baseball draft prep, but a concise resource for understanding the basics can be difficult to find. This article is an overview of key stats for fantasy baseball.
We'll define and explain many metrics fantasy managers may find useful, citing examples of how to use them in the process. Multiple degrees in applied mathematics are not required to use advanced metrics effectively, and this will be a no-math zone.
The focus will be on sabermetric statistics and ideas that are useful for predicting the standard stats that the vast majority of fantasy leagues care about, including batting average and home runs for hitters, and ERA and strikeouts for pitchers. Using these tools can give you a significant advantage on draft day and beyond.
Featured Promo: Save 50% the regular price with discount code SUMMER, for a limited time. Exclusive access to our Team Sync platform, DFS cheat sheets, Lineup Optimizers, betting/prop picks, and exclusive content from Nick Mariano and Eric Cross! GAIN ACCESS NOW
Hitting Metrics
BABIP (Hitters)
Definition: Batting average on balls in play (BABIP) is a hitter's batting average after homers, strikeouts, and walks are removed.
Why You Should Care: BABIP helps fantasy managers distinguish between small-sample flukes and legitimate breakouts. The league-wide BABIP was .291 last season; however, established players should be expected to regress to their career BABIP rather than the league's mark. Factors affecting BABIP include footspeed and line drive rate (LD%).
Examples: Bobby Witt Jr. posted a .334 BABIP in 2025, and he would lose a lot of fantasy value if we regress that to .291. However, Witt's footspeed helps him consistently best the league's BABIP, and his career mark is .320.
Kyle Schwarber had a .253 BABIP in 2025, creating considerable batting average upside if we expect regression to .291. Unfortunately, Schwarber lacks speed and will never beat out grounders that others do. His career BABIP of .263 is a much better expectation for 2026.
HR/FB Rate (Hitters)
Definition: Home run to fly ball ratio (HR/FB) measures the percentage of a hitter's fly balls that go over the fence.
Why You Should Care: HR/FB is the BABIP of power, allowing fantasy managers to separate fluke power seasons from breakouts. HR/FB surges can be supported by improved contact quality, significantly more pulled fly balls, and ballpark factors. Like BABIP, established players should be regressed to their career rate rather than the league's 11.9 percent.
Examples: Aaron Judge posted a 29.4 percent HR/FB last season, nearly triple the league's rate. He wouldn't be worth a first-round pick if his HR/FB regressed to 11.9 percent, but it won't. Judge's contact quality is special, and his career HR/FB of 31.7 percent is higher than last year's mark.
Batted Ball Distribution
Definition: Batted ball distribution refers to the percentage of a hitter's batted balls classified as grounders (GB%), fly balls (FB%), and liners.
Why You Should Care: Batted ball distribution provides insight into what type of fantasy asset a player is. Line drives are the best type of batted ball for offense, but LD% is a fickle statistic that usually doesn't predict future performance. GB% and FB% are much stickier, with heavy GB% rates increasing BABIP while FB% drives power production.
Examples: Luis Arraez has a career BABIP of .329 because he has a career LD% of 26.9 percent, a full seven points above the league's 19.7 percent rate last season. LD% isn't predictive in small samples, but Arraez has over 3,500 plate appearances in his MLB career. He clearly possesses line-drive skill.
Judge is such a prolific slugger because he's hit at least 46.2 percent of his batted balls into the air over the last three seasons, taking full advantage of his elite HR/FB. Grounders never turn into homers, even if you hit them as hard as Judge.
Launch Angle (LA)
Definition: Launch angle is the angle at which the ball jumps off the bat. It sounds complicated, but it's really a fancy way of describing batted ball distribution.
Why You Should Care: LD% isn't sticky, but it often explains why a batter posted a high or low BABIP. GB% and FB% are more predictive of future performance, with GB% supporting BABIP while FB% supports power. In-field fly ball percentage (IFFB%) also tells us how many of a hitter's flies are useless pop-ups.
Example: The following table identifies how launch angle correlates to batted ball types:
| Batted Ball Type | Launch Angle |
| Groundball | Less than 10 degrees |
| Line drive | 10-25 degrees |
| Flyball | 25-50 degrees |
| Pop-up | More than 50 degrees |
Pull%
Definition: Pull% is the percentage of a hitter's batted balls hit to their pull side.
Why You Should Care: Pulled batted balls are usually hit harder than those hit to center or the opposite field, but all pulled baseballs are not equal. Pulled grounders are often fielded without issue. Pulled flyballs offer much higher HR/FB rates and are extremely advantageous to hitters. Therefore, you always want to consider both Pull% and batted-ball type together.
Example: Cal Raleigh slugged 60 homers last season in part because he pulled 43.5 percent of his flyballs. His career rate is "only" 37.3 percent. The resulting 25.3 percent HR/FB was much higher than his 19.5 percent career rate, which understates the impact since his career rate now includes his magical 2025.
Plate Discipline (Hitters)
Definition: Plate discipline encompasses surface-level stats like strikeout rate (K%) and walk rate (BB%), plus peripheral stats that help predict them, such as chase rate (O-Swing%) and swinging strike percentage (SwStr%). Chase rate tells us how often a batter goes fishing outside the zone, while SwStr% measures how often they swing and miss.
Why You Should Care: Plate discipline is essential to projecting a player's batting average and becomes even more important in on-base percentage formats. If a player is striking out 35 percent of the time, you can't count on them for batting average, regardless of other skills. Likewise, plate discipline metrics help us determine whether a player deserved his K% and BB%.
Example: Pete Crow-Armstrong started the season on fire, but his plate discipline was atrocious. His 45.6 percent chase rate was 50 percent higher than the league's 31.5 percent rate, allowing pitchers to go out of the zone for a swing and a miss or weak contact. That weakness caught up to Crow-Armstrong, who hit just .216 with six homers in the second half.
Batting Order Slot
Definition: Where a hitter generally hits in the lineup.
Why You Should Care: Sabermetrics don't offer predictive metrics for RBI or runs scored because they're context dependent, yet these counting stats often represent 40 percent of a hitter's fantasy value. Paying attention to a hitter's lineup spot helps forecast these counting stats. Here's the value of each slot in 2025:
| Slot | PA | R | RBI | RBI+R |
| 1st | 22,401 | 3,077 | 2,216 | 5,293 |
| 2nd | 21,869 | 2,897 | 2,482 | 5,379 |
| 3rd | 21,387 | 2,718 | 2,729 | 5,447 |
| 4th | 20,905 | 2,507 | 2,890 | 5,397 |
| 5th | 20,391 | 2,322 | 2,506 | 4,828 |
| 6th | 19,855 | 2,069 | 2,203 | 4,272 |
| 7th | 19,296 | 2,055 | 2,036 | 4,091 |
| 8th | 18,687 | 2,031 | 1,920 | 3,951 |
| 9th | 18,135 | 1,938 | 1,760 | 3,698 |
Examples: Each lineup slot has about 500 fewer PAs than the one in front of it, which equates to about 17 per team. That doesn't sound like a lot, but it means the seventh hitter can expect 100 fewer PAs than his team's leadoff man. That makes it tough to compile stats from the bottom of the lineup.
Furthermore, teams cluster their best hitters together. The first four lineup spots are well over 5,000 RBI+R, fifth is considerably behind, and then production falls off a cliff. You want hitters in the meat of the lineup to maximize your fantasy team's counting stats.
Barrels and Barrel%
Definition: Barrels are defined as batted ball events at EVs and LAs that produce at least a .500 batting average and 1.500 slugging percentage since Statcast's inception in 2015. They are the most valuable batted balls.
Why You Should Care: Fantasy managers frequently look at barrels as a rate stat, either barrels per batted ball event (Brls/BBE) or barrels per plate appearance (Brls/PA). This approach has identified numerous sleepers since 2015.
Examples: The 2025 Brls/BBE leaderboard was topped by the four best sluggers in the league: Judge (24.7 percent), Ohtani (23.5 percent), Schwarber (20.8 percent), and Raleigh (19.5 percent). Kyle Stowers took fifth place with a 19% rate. Injury interrupted his breakout campaign, but don't underestimate his pop.
Bat Speed
Definition: Bat speed measures how fast a batter swings the bat in mph. Swings at 75 mph or above are considered "hard."
Why You Should Care: Swinging hard correlates strongly to power potential, making bat speed a good complement to Max EV; however, swinging hard also leads to more swing-and-miss, and rostering these guys can prove frustrating in fantasy.
Examples: The 2025 bat speed leaderboard includes Oneil Cruz (78.8 mph), Junior Caminero (78.5 mph), Jordan Walker (78.1 mph), Jo Adell (77.6 mph), and Schwarber (77.3 mph). Outside of Schwarber, all of these players possess elite raw power, but some aren't fantasy superstars due to strikeout concerns.
Exit Velocity (EV) - Hitters
Definition: Exit velocity is the speed at which the ball leaves the bat, measured in mph. Higher numbers are generally better for hitters, but slow rollers frequently turn into infield singles for faster players and may be better than medium-velocity grounders.
Why You Should Care: Fantasy managers use EV in two ways. First, average exit velocity provides insight into a hitter's contact quality. Many analysts focus on the average EV for flies and liners since grounders never produce power, no matter how hard they're hit. Second, Max EV provides insight into a player's power potential. The sample size is one, but you cannot fake EV.
Examples: The 2025 average EV leaderboard for flies and liners includes guys with elite raw power: Shohei Ohtani (100.4 mph), Schwarber (99.5 mph), Oneil Cruz and James Wood (99.4 mph), and Judge and Juan Soto (99.1 mph).
Ketel Marte's average EV on flies and liners (94.9 mph) ranked 74th among qualifiers, but his max EV of 119.6 ranked fourth and proves he can deliver the power fantasy managers crave.
Statcast Sprint Speed
Definition: Statcast Sprint Speed measures a player's fastest one-second window on competitive plays, like advancing two bases on a single and running to first on weak grounders. It's measured in feet per second (ft./sec), with 27 the MLB average and 23-30 the competitive range.
Why You Should Care: Sprint Speed tells us who can beat out grounders for hits and steal bases (though some fast players don't steal). It also quantifies a player's athleticism, and a sharp decline could indicate injury or the aging process.
Examples: The 2025 Sprint Speed Leaderboard passes the sniff test for fastest guys in the majors: Trea Turner (30.3 ft./sec), followed by Witt, Victor Scott II, and Byron Buxton (all 30.2 ft./sec).
Pitching Metrics
Plate Discipline (Pitchers)
Definition: K% and BB% are just as important for pitchers, and they can be predicted through plate discipline stats like SwStr%, Zone%, chase rate, and Contact%, both in (Z-Contact%) and outside (O-Contact%) the strike zone.
Why You Care: Strikeouts are a category in most fantasy leagues, while walks are a primary driver of WHIP. K-BB% (subtracting BB% from K%) is one of the best single-number indicators of a pitcher's quality, making these metrics usable even in formats that don't directly score strikeouts or walks. A great pitcher will have a K-BB% of 20 percent or higher.
Example: Paul Skenes dominates on the mound, posting an elite 1.97 ERA across 182 2/3 innings pitched in 2025. His 29.5 K% and 5.7 BB% reflect that dominance, giving him an ace-like 23.8 K-BB%. Skenes also posted outstanding peripherals, including a 13.8 SwStr%, 52.6 Zone%, and 80.2 Z-Contact%, so his K% and BB% weren't flukes.
HR/FB (Pitchers)
Definition: Home run-to-fly ball ratio from the pitcher's perspective.
Why You Care: Pitchers exert some control over HR/FB, but hitters have more control. If a pitcher's HR/FB suddenly balloons, it will ruin his ERA for the season. However, savvy fantasy managers know that such HR/FB swings generally aren't predictive of future performance, creating buy-low opportunities on draft day.
Example: Jeff Hoffman had a season to forget in 2025, posting a 4.37 ERA before blowing Game 7 of the World Series to Miguel Rojas and the Dodgers. Hoffman's 20 percent HR/FB explains nearly all of his troubles, but he posted single-digit rates in 2022 (7.5 percent), 2023 (6.7 percent), and 2024 (9.4 percent). He's due for a bounce-back in 2026.
FIP/xFIP
Definition: Fielding Independent Pitching (FIP) and expected Fielding Independent Pitching (xFIP) attempt to separate a pitcher's true talent level from his teammates by focusing on three inputs: K%, BB%, and HR/FB. FIP uses a pitcher's actual HR/FB, while xFIP assumes a league-average HR/FB based on his fly balls allowed. Both metrics are on the ERA scale.
Why You Should Care: FIP and xFIP help us evaluate pitcher performance. Is a strong first-half ERA sustainable or primarily luck-based? Did last season's highly-touted rookie deserve his bloated ERA, or is he worth investing in again based on his underlying skills? Incorporating FIP and xFIP is more predictive than looking at ERA alone.
Example: Cole Ragans endured a disappointing 2025, posting a 4.67 ERA over 61 2/3 innings pitched. A left rotator cuff strain was responsible for the low workload, but his 2.50 FIP and 2.45 xFIP suggest that his underlying skills were still ace-level when on the field. Don't be fooled by his inflated ERA.
xERA
Definition: Expected Earned Run Average (xERA) is similar to FIP and xFIP, but it accounts for the launch angle and exit velocity of batted balls allowed by the pitcher rather than assuming they have no control beyond K%, BB%, and HR/FB. The metric is a 1:1 translation of Baseball Savant's xwOBA (expected weighted on-base average) metric.
Why You Should Care: xERA provides another data point to help us better understand a pitcher's true talent. If a pitcher is particularly prone to hard contact, FIP and xFIP will make him look better than he is, while xERA provides a more realistic assessment of his abilities.
Example: Ragans had a 2.68 xERA last season, so he didn't "deserve" his bloated ERA. When FIP, xFIP, and xERA all agree, we can be very confident that a pitcher's ERA should be close to them.
SIERA
Definition: Skill-Interactive Earned Run Average (SIERA) quantifies pitcher performance like FIP/xFIP/xERA but adjusts for the types of batted balls pitchers allow. Notably, it is not on the ERA scale, with an average of 4.06 in 2025 to the league-wide 4.16 for ERA, xERA, FIP, and xFIP.
Why You Should Care: SIERA was developed to improve on xFIP by accounting for what happens after the ball is in play, but it didn't catch on before xERA leveraged Statcast data to do the same on the ERA scale. It's still cited occasionally, however, so fantasy managers should know what it is.
Example: Ragans had a 2.52 SIERA last season, further suggesting his ERA was a fluke.
BABIP (Pitchers)
Definition: Batting average on balls in play, but from the pitcher's perspective.
Why You Should Care: Generally speaking, flyball pitchers allow lower BABIPs because flies have lower BABIPs than grounders, while groundball specialists allow higher BABIPs in exchange for home run suppression. Team defense and stadium can also support low BABIPs allowed.
Examples: Logan Webb is widely recognized as a good pitcher, but his .316 career BABIP is well above league average (.291). That's because Webb has a career GB% of 57.1 percent. His strategy is to give opponents a few singles so they hit fewer homers, and it works for him.
Freddy Peralta goes the other way, allowing just a .243 BABIP last season thanks to a 45.7 FB%. He allowed over a homer per nine innings, but he still posted a sterling 2.70 ERA by limiting baserunners. The Brewers were also the third-best defensive team by Outs Above Average (OAA), further limiting Peralta's BABIP allowed.
Pitch Info
Definition: Pitch Info provides detailed information on individual pitches in a hurler's repertoire, with SwStr%, chase rate, Zone%, and GB% often of paramount interest in fantasy.
Why You Should Care: Pitch Info helps fantasy managers forecast whether pitch mix changes are responsible for performance shifts. Pitch Info is also used to identify sleepers based on potential changes to their arsenals. Eliminating ineffective offerings may improve pitcher performance, while throwing more sliders with a 20 SwStr% could improve an arm's K%.
Examples: Trevor Rogers improved dramatically in 2025, seeing his K% spike from 17.3 percent in 2024 to 24.3 percent last season. Throwing more strikes helped, as his fastball (54.1 percent to 68.3 percent), sinker (56.3 percent to 61.4 percent), changeup (38.3 percent to 46.3 percent), and slider (42.9 percent to 47.6 percent) all saw notable Zone% increases.
Cade Horton underwhelmed with his 20.4 K% last season, but Pitch Info sees strikeout upside in his slider (19 SwStr%, 39.9 percent chase rate) and changeup (21.5 SwStr%, 32.3 percent chase). Horton should generate more strikeouts in 2026, especially if he throws more sliders and changeups.
Stuff+
Definition: Stuff+ is a pitching model focused on the physical characteristics of a pitch: velocity, movement, release point, spin rate, etc. Secondaries are graded in relation to a pitcher's primary pitch (usually a fastball), meaning an 80-mph change scores better by Stuff+ if the fastball is 97 instead of 93 due to improved velocity differential. All pitches are scored on a base-100 scale.
Why You Should Care: Pitchers cannot fake physical stuff, so a Stuff+ improvement could suggest a breakout before traditional metrics like ERA do. Stuff+ is also available for individual pitches, allowing it to be used like Pitch Info to evaluate repertoire shifts.
Example: Stuff+ is still a relatively new tool for fantasy managers and continues to evolve, so we aren't sure how to optimize it yet.
The 2024 Stuff+ leaderboard was led by Corbin Burnes (113), followed by Tarik Skubal and Aaron Nola (112), Carlos Rodon (111), and a three-way tie between Zack Wheeler, Ragans, and Dylan Cease. Burnes, Nola, Wheeler, and Ragans all spent significant time on the IL. Burnes, Nola, Ragans, and Cease had bloated ERAs when on the field, so Stuff+ didn't identify sleepers in 2025.
Location+
Definition: Location+ is a count and pitch type-adjusted pitching model that evaluates a pitcher's ability to hit his spot. It's impossible to ask pitchers where they wanted every pitch, so Location+ assumes league-wide intent. A 0-2 splitter should be bounced, so pitchers are credited if it misses the zone and penalized if it doesn't. Again, Location+ is scored on a base-100 scale.
Why You Should Care: Location+ is sometimes used to project BB%, which doesn't work since the right location is a ball in certain situations. Instead, Location+ quantifies command, something essential to pitching success but not really quantifiable until now.
Example: Location+ is still relatively new, too, and the metric had mixed results last season.
The 2024 leaderboard included Pablo Lopez and Logan Gilbert at 113, Chris Sale at 111, George Kirby at 110, and a three-way tie at 109 between Erick Fedde, Zach Eflin, and Shota Imanaga. It's a list of established aces, injuries in the cases of Lopez and Sale, and 2025 disappointments in Kirby, Eflin, and Imanaga (add Fedde if you were expecting anything from him). Not great.
Pitching+
Definition: Pitching+ is an advanced pitch modeling system that attempts to distill a pitcher's physical stuff, location, and overall effectiveness into a single number on a base-100 scale. It is not a weighted average of Stuff+ and Location+, but also incorporates additional information, such as platoon splits.
Why You Should Care: One number that captures all the variables involved in pitching analysis would be a game-changer for fantasy baseball analysis.
Example: Pitching+ involves many of the same inputs as Stuff+ and Location+, so the 2024 leaderboard wasn't a great predictor of 2025 success.
Burnes topped the list with a score of 119, followed by Wheeler and Cease at 113, and the triumvirate of Webb, Kirby, and Skubal at 112. Projecting the reigning Cy Young award winner to be good isn't difficult, and Webb is an established fantasy arm as well. Otherwise, the list is full of injuries and disappointing campaigns.
Spin Rate
Definition: Spin rate measures how much a pitched ball spins in rotations per minute (RPM). Fastballs generally have spin rates in the 2,100-2,400 RPM range, while breaking pitches have higher spin rates. Off-speed stuff generally has lower spin rates.
Why You Should Care: Spin rate is one of the most important metrics for determining pitch efficacy. High-spin fastballs generate strikeouts and induce weak airborne contact, giving pitchers a BABIP suppression skill. Low-spin fastballs generate groundballs. Breaking pitches have more movement the more spin they have, while changeups and splits move more with less spin.
Examples: Eury Perez led MLB starters in fastball spin rate last season at 2,686 RPM. His heater performed as expected, generating a 10.7 SwStr% and inducing plenty of weak pop-ups with a 54.9 FB% and 17.7 IFFB%.
Ranger Suarez was dead last in fastball spin rate at 1,950 RPM. It didn't generate many whiffs with a 2.4 SwStr%, but made up for it by inducing tons of grounders (62.9 GB%). Both approaches can work, but fantasy managers usually prefer the high-spin approach for strikeouts and less reliance on defense.
Active Spin
Definition: Active spin is the percentage of a pitch's spin that actively contributes to movement. Think of a thrown football. The ball rotates in midair but flies true to its target. The football has low active spin because the rotation doesn't affect its trajectory.
Why You Should Care: Active spin explains why high-spin or low-spin fastballs don't perform as expected by spin rate alone. If a high-spin heater has low active spin, it won't generate as many whiffs or induce pop-ups. Likewise, low-spin fastballs with high active spin won't produce as many grounders.
Example: Tyler Mahle's fastball performed well in 2025, producing a 9.1 SwStr%, 41.5 FB%, and 15.4 IFFB% despite averaging just 92 mph and an average spin rate of 2,333 RPM. The reason was Mahle's league-leading 99.7 percent active spin on his fastball, ensuring every rotation affected the pitch's trajectory.
Statcast Pitch Tracking
Definition: Statcast Pitch Tracking is Baseball Savant's version of Pitch Info.
Why You Should Care: Statcast Pitch Tracking provides information that Pitch Info doesn't, most notably platoon splits for individual pitches. A basic Pitch Info analysis might suggest a pitcher should eliminate a pitch from his repertoire, while Statcast Pitch Tracking reveals it's actually essential against lefties or righties. The use of expected statistics mitigates any sample-size issues.
Example: Garrett Crochet threw a sinker 16 percent of the time in 2025, but his fastball was much better by SwStr% (12.5 to 8.4) with a comparable Zone% (57.1 to 58). Why did he bother? Crochet's sinker limited lefties to a .176 average, .219 xBA, .176 slugging, and .254 xSLG, while lefties teed off on his fastball at .290/.213/.548/.363, respectively. He needed his sinker against LHB.
Other Important Statistical Terms
Statcast
Definition: Statcast is a catch-all term for the various metrics available on Baseball Savant. Fantasy managers are especially interested in exit velocity, launch angle, spin rates, and footspeed (among others).
Why You Should Care: Statcast provides objective, quantifiable answers to questions baseball fans have asked for years. We can distinguish between 95-mph and 101-mph batted balls instead of lumping them together through a proxy like HardHit%, measure how fast "fast" guys are, and explore the mechanics that make pitches effective.
Example: Most Statcast metrics are found on player profiles. Every fantasy manager should be familiar with them, so here's Aaron Judge in 2025:
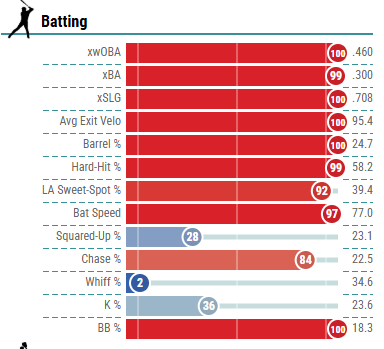
Dark red correlates to elite performance, and Judge has a lot of it above. Dark blue represents low percentiles, and Judge has more swing-and-miss in his game than we would like. Of course, his contact quality more than makes up for it.
Foreign Stats
Definition: Player performance in foreign leagues, such as the Korean Baseball Organization (KBO) and Nippon Professional Baseball (NPB). Detailed Statcast-like information is available for NPB players for hitters and pitchers.
Why You Should Care: Korean players such as Ha-Seong Kim, Jung Hoo Lee, and Hyeseong Kim generally need an adjustment period since MLB pitching is much more advanced than KBO arms.
Japanese players such as Kodai Senga, Imanaga, and Yoshinobu Yamamoto have won fantasy leagues in recent years, but there have been busts, too. Understanding what to expect from these relative unknowns provides a tremendous advantage.
Example: Three major Japanese players are entering MLB this season: Tatsuya Imai, Munetaka Murakami, and Kazuma Okamoto. Here's Imai's "Statcast" profile:
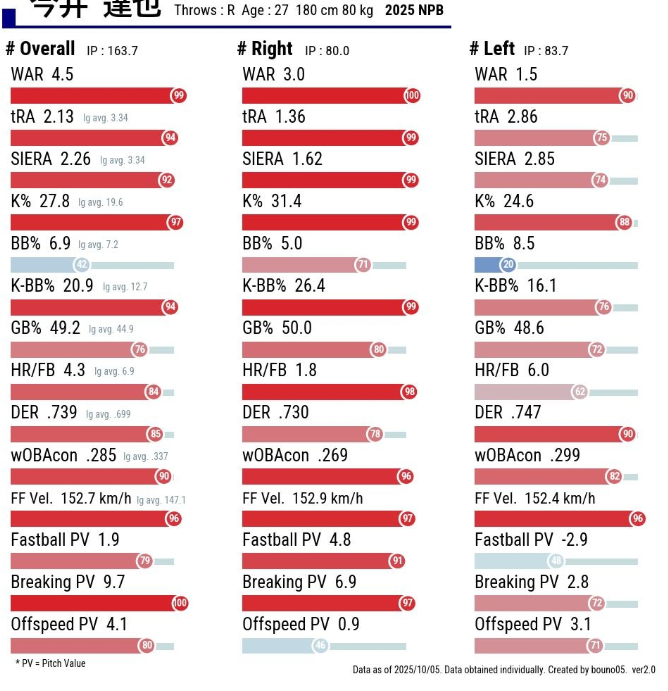
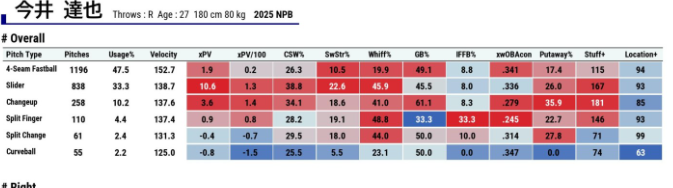
He generates Ks, keeps the ball on the ground, and doesn't walk too many with at least a five-pitch mix. Imai seems to possess all of the tools required for MLB success.
Ballpark Factors
Definition: Ballpark factors quantify the stadium's effects on player performance. Multiple sources are available, and none of them is "wrong." They all use similar methodologies and a scale where 100 is average. Higher numbers mean more of an event, while lower numbers mean less of the event.
Why You Should Care: Most fantasy managers understand that ballparks influence home runs, and ballpark factors tell us by how much by platoon split. Furthermore, ballparks significantly impact BABIP, doubles, and even K%. Every MLB park has a quirk, and ballpark factors help us incorporate them into our game.
Example: The Colorado Rockies posted a .330 BABIP at home and a .263 BABIP on the road in 2025, with similar splits throughout their history. The reason why is Coors Field, which inflated every hit type from 2023-2025: singles (116 park factor), doubles (119), triples (202), and homers (106). Coors also suppresses strikeouts (90), giving it a league-leading 113 park factor for scoring.
Minor League Baseball (MiLB) Stats
Definition: The stats that minor leaguers post at Triple-A, Double-A, and A-level ball. They mostly work the same way as MLB stats, except league averages vary. Notably, Triple-A has become an extremely offensive league in recent years, inflating offensive performance while making pitchers look less effective.
Why You Should Care: Prospects are potential sleepers on draft day, frequent waiver claims in-season, and the lifeblood of successful teams in keeper and dynasty formats. You need to know how to evaluate prospect performance to compete in modern fantasy baseball.
Example: Nolan McLean was great for the Mets down the stretch last season, and fantasy managers saw it coming if they looked at his MiLB stats. He threw 26 1/3 innings at Double-A with a 27.8 K%, 1.37 ERA, and 3.23 xFIP. McLean earned a promotion to Triple-A, where he threw 87 1/3 innings with a 27% K%, 2.78 ERA, and 3.90 xFIP in a hitter-friendly environment. He was ready.
Expected Stats (xStats)
Definition: Statcast's xStats quantify what batting average (xBA), slugging percentage (xSLG), and weighted on-base average (xwOBA) players deserve based on their exit velocities and launch angles. They factor luck and defense out of the equation.
Why You Should Care: xStats help fantasy managers determine a player's true talent level, but they shouldn't be the end of your analysis. Fast players consistently outperform xBA thanks to their wheels, and some of the luck that differentiates expected stats can be controlled for. Look at xStats, but don't use them as a blind projection.
Example: Xavier Edwards hit .328 against an xBA of .252 in 2024, so savvy fantasy players knew he was bound to regress last season. His xBA largely repeated at .258, but his actual average of .283 was still higher. Edwards has 75th-percentile sprint speed (28.3 ft./sec), helping him beat his xBA but not by the 76-point differential he posted in 2024.
Conclusion
Advanced stats can do a lot more than what's listed above, but these concepts are more than enough to help you start using analytics to make smart fantasy baseball decisions. You'll see RotoBaller analysts using the metrics above regularly, so read some articles and get a feel for how to do your own analysis to dominate your 2026 fantasy leagues!
More Fantasy Baseball Advice
Download Our Free News & Alerts Mobile App
Like what you see? Download our updated fantasy baseball app for iPhone and Android with 24x7 player news, injury alerts, sleepers, prospects & more. All free!